Leon Robinson, Retired and Mark Morgan, Derrick Equipment Co.
 This paper was prepared for presentation at the AADE 2005 National Technical Conference and Exhibition, held at the Wyndam Greenspoint in Houston, Texas, April 5-7, 2005. This conference was sponsored by the Houston Chapter of the American Association of Drilling Engineers. The information presented in this paper does not reflect any position, claim or endorsement made or implied by the American Association of Drilling Engineers, their officers or members. Questions concerning the content of this paper should be directed to the individuals listed as author/s of this work.
![1333444723[1]](https://shakerscreen.com/wp-content/uploads/2016/04/13334447231.jpg) Abstract The API Sub-Committee 13 organized a Task Group to rewrite the API RP13C (the recommended practice for drilling fluid processing systems evaluation) and 13E (the recommended practice for shale shaker screen cloth designation) before they were submitted to the International Standards Organization (ISO) to become an international standard. The Task Group completed its work during the past year and new procedures are now in place to describe solids control equipment. The major change is in the way shale shaker screens are described.
Abstract The API Sub-Committee 13 organized a Task Group to rewrite the API RP13C (the recommended practice for drilling fluid processing systems evaluation) and 13E (the recommended practice for shale shaker screen cloth designation) before they were submitted to the International Standards Organization (ISO) to become an international standard. The Task Group completed its work during the past year and new procedures are now in place to describe solids control equipment. The major change is in the way shale shaker screens are described.
Introduction/Background A brief review of the history of shale shaker screens may help to understand how difficult it was to arrive at the changes that eventually were agreed upon.
Initially screens were easy to describe. They were square mesh made with market grade wire. The mesh size was the number of openings per inch in two directions.
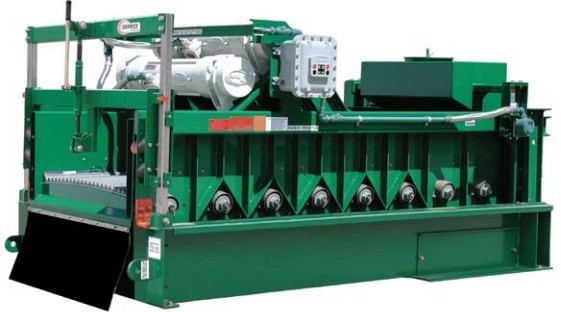
DERRICK FLC 500 shale shaker
Louis Brandt designed a triple-deck, circular motion shaker for a mud company that was not marketed very successfully and subsequently was not used by many people. He left that organization and formed his own company where he began manufacturing a double deck, circular motion shaker. To improve volume throughput, he also introduced a “B” series of screens which had rectangular openings. The B-60 had about 44 openings in one direction and about 12 openings in the other direction (Fig.1). He correctly diagnosed that rig hands were only measuring the volume flow rate through the screens [rig pump rate] and had little way to measure relative quantities of solids removed from a drilling fluid.
Other wire sizes (many of which were smaller in diameter) were introduced which gave the same number of openings per inch, but ended up having larger openings due to the smaller diameter wire. This was in contrast to what a standard ASTM screen would have had. The new type of screens could legitimately report the mesh count and also have superior capacity, or throughput. It was argued by some that the superior throughput was being obtained by allowing more drill solids to be returned to the pits.
The size of solids moving through a screen depends on mesh AND on the diameter of the wire. The openings (and the solids that pass through it) are larger if the wire has a small diameter (Fig.2).
The wire mesh on the left will have a greater flow capacity but will also return more solids to the drilling fluid. Specifying “mesh” does not necessarily identify the ability of a shaker screen to remove solids.
The next problem with describing shaker screens was the problem with multilayers of screens. If screens with two different mesh counts are placed on top of each other, a large assortment of openings is created. Service companies have found that these screens do a good job of removing solids but, almost surprisingly, have a much higher fluid capacity than expected. These screens have become common on drilling rigs.
To solve the description problem, the recently supplanted RP 13E document tried to determine a particle separation potential by looking at 1500 openings in a screen with a microscope. The length, width, and height of these 1500 openings were measured. An ellipsoidal volume was calculated for each opening. Each ellipsoidal volume was then translated into a spherical volume and a diameter of the sphere was calculated for each opening. These diameters were then plotted as a cumulative percent. The diameter representing 16%, 50%, and 84% of the distribution were to be reported as the d16, d50, and d84. The lower case letter ‘d’ was used to separate it from a real separation curve.
A D50 separatio n means the diameter where one-half the solids are captured on the screen and one-half of the solids pass through the screen. The 16 and 84 numbers were selected because these are one standard deviation away from the mean in a Gaussian distribution. (To be continued)